Kisi’s occupancy index shows that overall office occupancy has stabilized around 50-60% nationwide.
While the first initiative has been to safely get employees back to work, most organizations are now looking to increase collaboration and productivity by leveraging in-person interactions - especially in hybrid work models. Companies are increasingly sensitive to the cost of the workplace as well as the impact on recruiting and retention.
A quick note before we get started: If you’re new to the topic of work models and return to office (RTO) strategy, read our guide about the future of the workplace.
If you’re currently drafting your workplace strategy or you already have one: To properly enable, support, and plan office resources, a granular data analysis is required, beyond the typical measured “general occupancy”.
What is workforce analytics #
Workforce analytics is the process of collecting, analyzing, and interpreting data related to the workforce within an organization.
Purpose of workforce analytics:
- Employee engagement and satisfaction
- Effective recruiting
- Performance optimization
- Strategic planning
Key elements of workforce analytics:
- Data collection from HR systems, surveys or reviews
- Data analysis including machine learning and AI
- Reporting and visualization in dashboards or reports
- Benchmarking against industry standard or competitors
Types of workforce analytics data sources #
Workforce data comes from HR, recruiting, collaboration or financial systems used in a company. Here are a few examples of workforce data:
- Core HR data including demographics from Human Resource Information Systems (HRIS)
- Payment information from payroll systems
- Performance reviews from performance management software
- Application and recruiting metrics from applicant tracking systems (ATS)
- Training records from learning and development systems
- Qualitative insights from surveys, pulse checks, engagement scores, feedback forms, and more
- Employee attendance, absences, and work hours from time tracking and attendance systems
- Email, messaging, and project management usage from collaboration and communication tools
- Financial performance from accounting systems
What is workplace analytics #
Related, but different to workforce analytics is workplace analytics. Workplace analytics gives insights into how employees interact with their physical and digital work environment through space, technology, and communication usage data to optimize and plan the work environment.
Purpose of workforce analytics:
- Productive and collaborative workspace design and improved office layout
- Improved communication and teamwork through better use of space and technology
- Informed workplace planning and real estate strategy
- Data-drive approach to safety and security insights
Key elements of workforce analytics:
- Workplace usage - commonly referred to as space utilization
- Workplace technology usage - how different technologies are used
- Trends in working hours, remote work, and productivity - which can be interpreted as work patterns
Types of workplace analytics data sources #
Generally, we see workplace data from IT and workplace and security systems being combined with workforce data from HR and financial data. When simplifying this scenario, we could focus on four different data sources:
1. HR systems
- Employee feedback tools including pulse surveys
- Intranet usage
- Mental and fitness apps usage
2. IT systems
- Computer and device logs
- Location based services including WiFi access points or bluetooth sensors
3. Workplace software
- Digital collaboration tools including email, messaging, and project management
- Meeting and scheduling tools including room or desk booking software
- Collaboration software usage
4. Security sensors and systems
- Physical environment sensors like occupancy, motion or environmental sensors
- Building management systems including access control, video surveillance, HVAC and lighting systems
Overlayed with each other, these data sources can provide valuable insights into the workplace usage.
Bridging the gap between workforce and workplace data analytics #
While typically workplace and workforce data are tracked separately, the true value is uncovered when both data are combined.
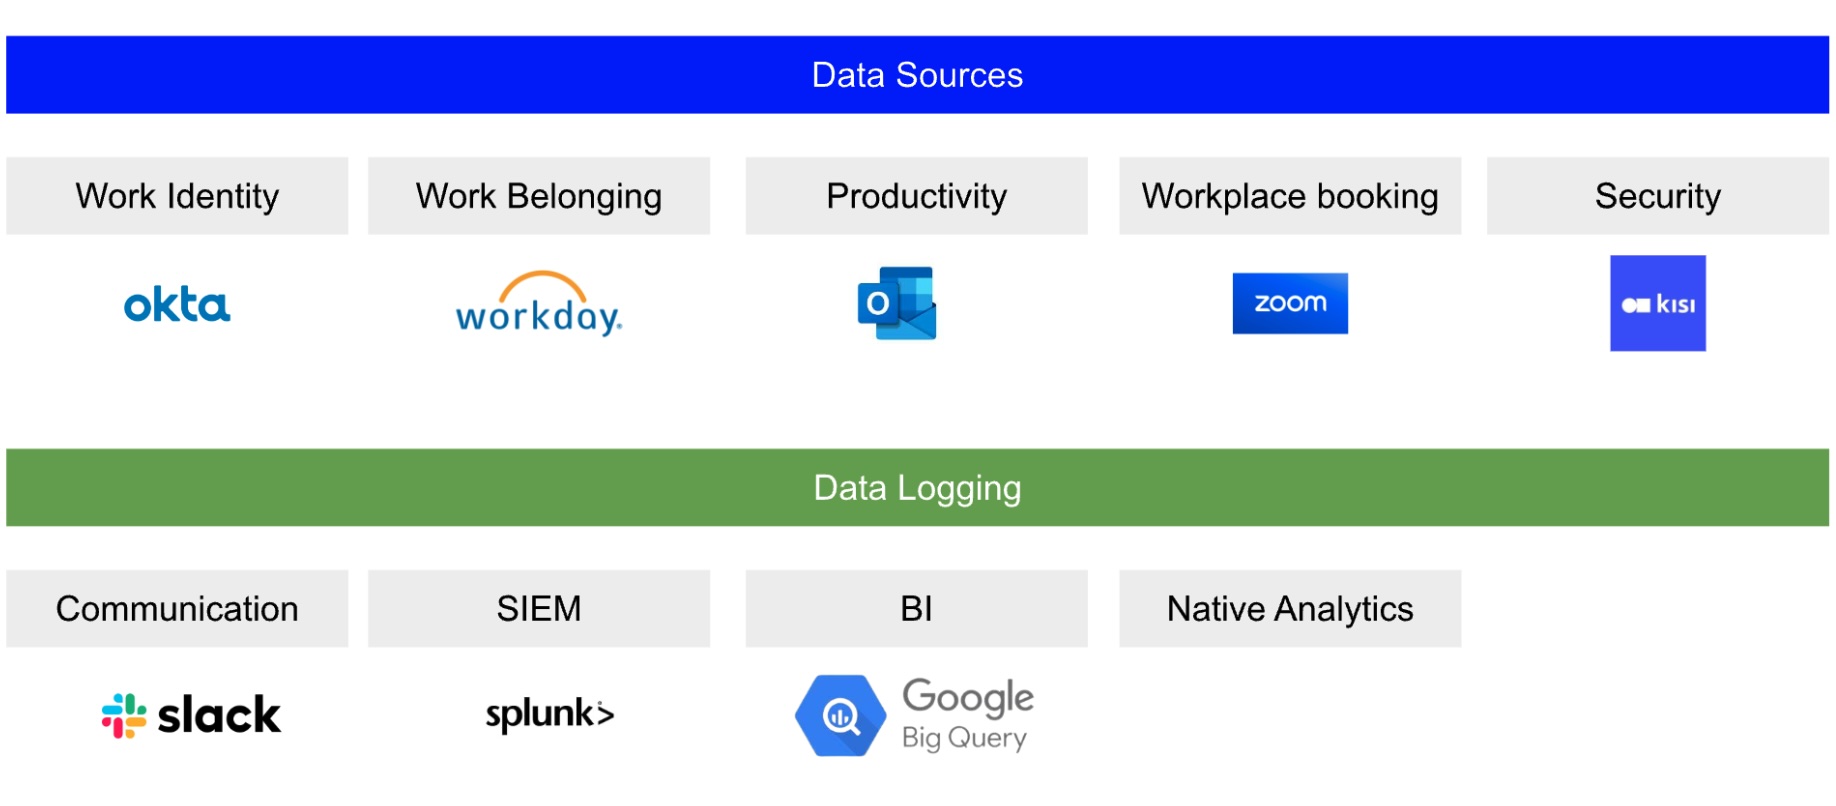
We can categorize the data sources into workforce sources, centered on the employee, and workplace sources, centering on the workplace infrastructure and systems. Both categories include core systems from the HR and IT side, as well as newer data sources that include workplace and physical security systems.

A typical setup of data sources and data logging systems is shown below. Data sources include work identity, work belonging, productivity information, collaboration schedule, and security data. On the data logging side this data gets pushed into communication tools, SIEM’s, data warehouses or natively pulled from the data sources’ analytics.
Why analyze workforce and workplace data? #
In todays’ hybrid workplaces it is very common that leaders decide on an office mandate, where employees are expected to work from the office on specific days of the week. However, mandates might not always land well for teams, as they might prefer having more flexibility in choosing which days they prefer to come to the office.
If you have a team - maybe a fast growing organization - and you want to encourage productivity and collaboration, this might sound relatable for you. Besides discussing mandates, deciding on how the workplace evolves, what real estate to lease, how to structure employees per location, and which rules or guidelines apply to them is essential. And that's why you will need all the data you can get to make the right decisions for your company and your team.
In the following sections we provide an overall framework on how to find and analyze relevant data. You will also learn from specific examples and data-driven ideas and best practices that help promote productivity and collaboration at work.
The best workplace and workforce analytics software by data source #
Workplace data from security systems
Access control systems like Kisi provide comprehensive workplace usage data, including badging and identifiable occupancy data.
Workplace data from IT systems
Data from IT systems are typically identity and access systems like Okta, Entra ID or Sailpoint but also device-based WiFi usage data.
Workforce data from HR systems
HRIS systems such as Workday, Rippling, Trinet, Justworks or ADP usually allow setting up home offices and belonging to teams. This data is often pulled into the identity systems. At Kisi we also leverage calendar based office preferences in Google Calendar. Other directories like Outlook might have similar settings.
Workforce data from workplace systems
Data from workplace tools include workplace booking and collaboration software such as Envoy, Webex, Zoom, Gable, Microsoft or Google. In addition, temporary office data can be pulled from travel booking software including Navan or Travelperk.
Workplace data report examples #
To give you some practical examples, we aggregated useful industry statistics that we came across here in Kisi. This is not supposed to be an exhaustive list but rather give some inspiration on what is possible to consider in terms of data. Every workplace strategy has different goals so you still need to decide which data is the most important for your company.
Workplace data from security systems
Workplace data reports can be pulled on a daily, weekly or monthly basis for different purposes:
- Daily reports: Dynamic data to see short term performance of the space;
- Weekly reports: Longer term trends in occupancy;
- Monthly reports: Typically used to measure total activation as every user showing up once per month at work will be counted.
Office occupancy data reports
These reports measure presence at workplaces - generally calculated by badge usage data coming from unique users unlocking doors.
Daily occupancy bar chart
Daily occupancy is important when planning workplace capacity. Wednesdays tend to be the busiest weekday and workplace policies can regulate the natural occupancy pattern to be more balanced throughout the week. For instance, by implementing a shifted schedule of different teams.
Daily occupancy spreadsheet
Looking at daily place usage on a spreadsheet can give you a quicker insight into the % of occupancy reached during that given day. This type of chart is typically used to determine short turnaround capacity tracking and - planning.

Weekly occupancy bar chart
Weekly occupancy is a great way to see how the office performs week over week. While general attendance does not provide insights into productivity or collaboration, this metric indicates trends in office occupancy.

Occupancy by usage pattern
Over time, workers form behaviors of coming to work a specific number of days. These trends are best analyzed as a usage pattern chart which groups employees coming in every day, 2-4 days, once a week, once a month or never. Breaking down this chart by team will give more insight into specific trends.

Individual occupancy presence data
Mostly used for time and attendance, badge in and badge out data can be used to calculate exact presence on site. This is typically used for hourly billed workers to validate clock-in and clock-out metrics but can also be used to understand specific workplace occupancy.

Past 90 day presence data per workday
Analyzing individual presence patterns per workday can offer valuable insight into shifts in behavior or established patterns.

Forecasted office presence
Based on the past 90 days' first arrival time during a workday, the predicted arrival time can be forecasted relatively accurately - in this case, it is 8.15 AM.

Workplace experience adoption
Companies often have a mobile initiative around the workplace. Physical security analytics can help gain insight into mobile access adoption and usage. To see how people get into the workplace we pull the information from Kisi to understand unlocks by credential type but also include however other ways the door was unlocked. For instance, from a pressed request to exit button.

Workplace data from IT systems #
Location analytics
Analyzing devices connected to the internet can give you insights into presence and activity as well. A unique data point here is the duration, during a given day, that the device was connected which can give insights into how long the presence of the user was as well.

Location analytics from IT routers (source)
Location heatmaps
Part of Meraki's location capabilities include the ability to visualize where people are spending time inside a particular location over the course of the day - regardless of whether or not their devices are associated with the wireless network. This data is overlaid on a floor plan or Google maps, and can give network administrators and marketing/operations teams information on guest foot traffic flows within certain parts of a store or building.
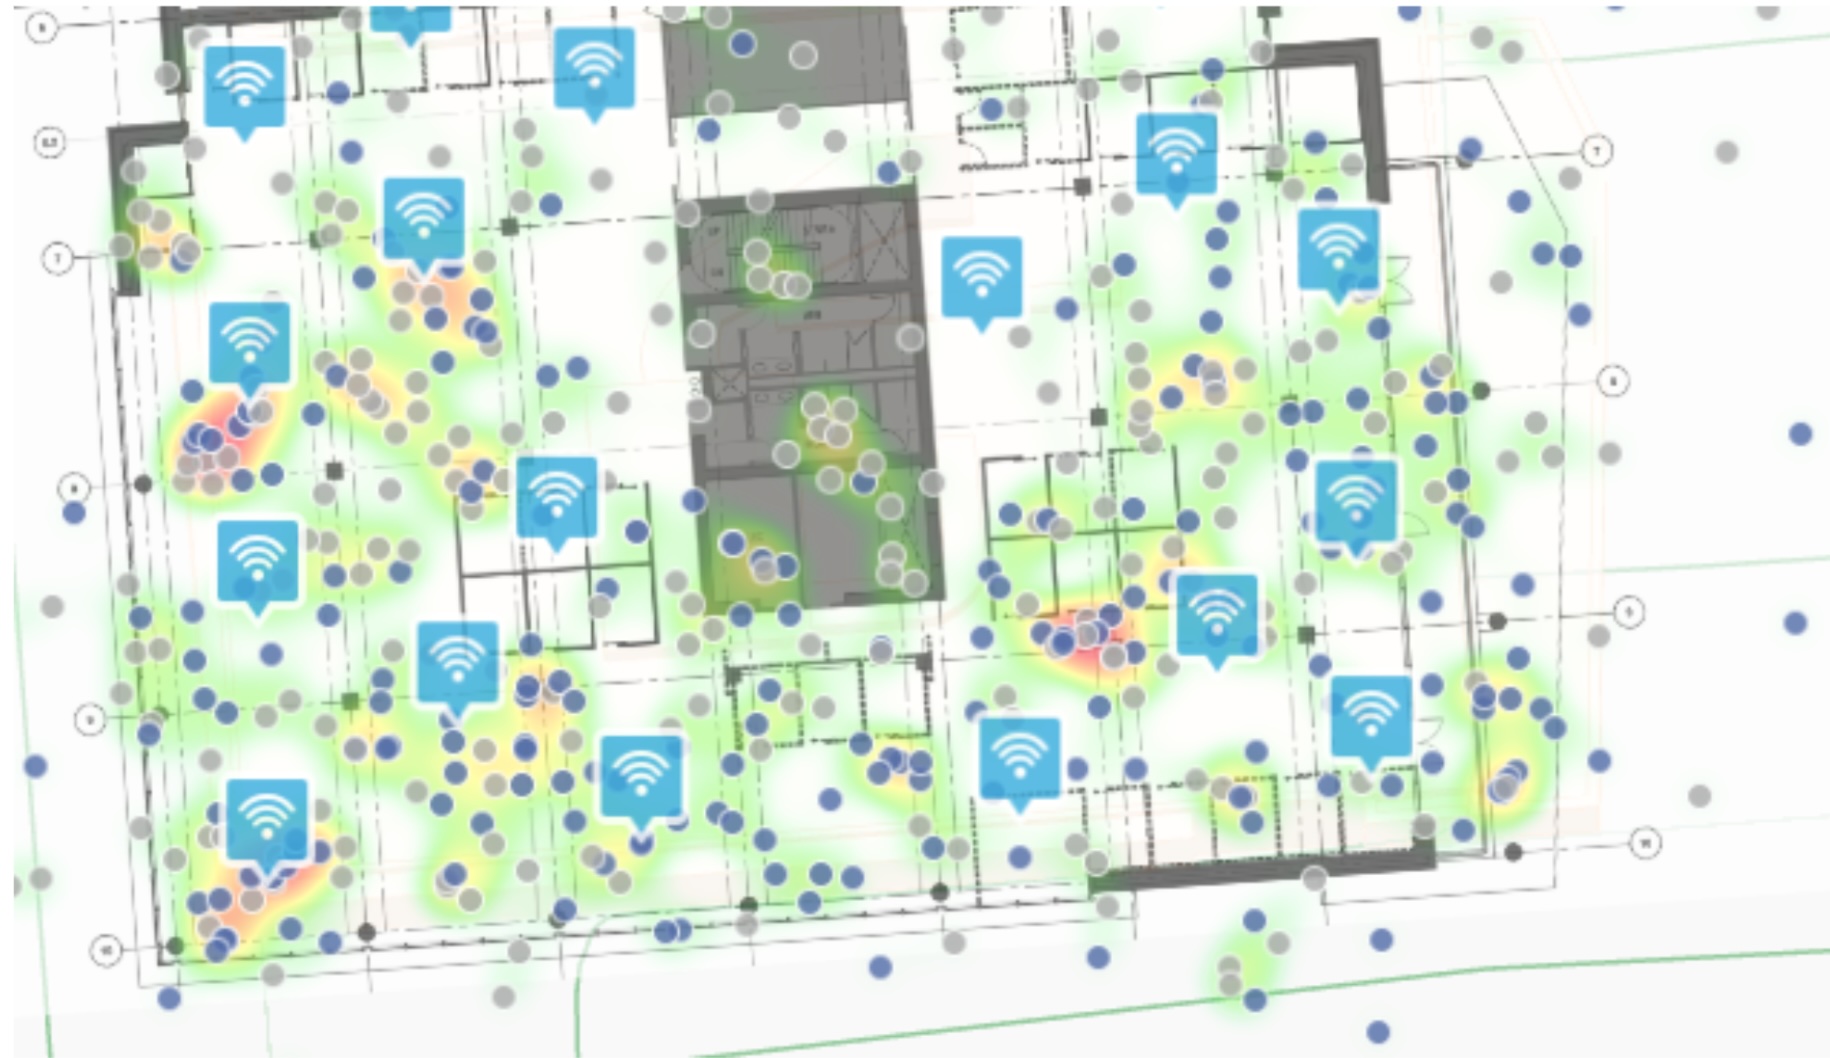
Location analytics map based on device connectivity (source)
Workforce data from HR systems #
Permanent schedules are typically pulled from HR systems or calendars.
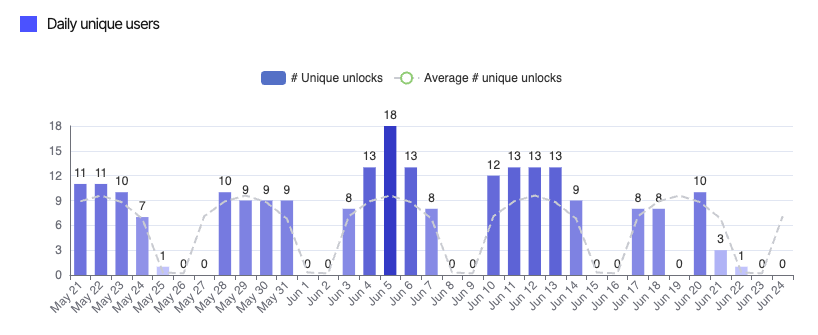
Expected occupancy
Workplace operators need to accurately forecast and track workplace usage and capacity. Often, companies use the location function in calendars to indicate the schedule. We can use that data to calculate “expected occupancy” - sometimes you would need to add scheduled visitor data to it as well.
This is why at Kisi we pull the workplace schedule as an indicator for “expected occupancy”.
To analyze planned VS. actual usage, we pulled the number of planned users from Google Calendar as Kisi employees who set their office location as NYC office that specific day.
We compared this data to the number of real users pulled from unique unlocks in the badging data.
What you can see in the chart is that we’ve had much higher occupancy than expected. This led us to create another control chart below.

Based on the initial findings, we created a control list of users who set wrong or no office location in Google calendar. This allowed our HR to reach out to the colleagues to correct the data inputs.

Occupancy by team
Analyzing team based occupancy is helpful to understand team dynamics in workplace usage. Pulling the team from the HR system and combining it with actual badge-in occupancy data gives insights which teams are showing up and in what capacity.
This is also sometimes called the “Office Show-up Rate”. Assigned offices to the general employee population combined with actual badge-in occupancy data gives insights into assigned office VS. actual show-up data.

Workplace booking tool reports #
Number of bookings per day and type
As workplaces require reservations to understand demand, employees are asked to book workplaces. Using booking per day and type dashboards allows to analyze usage by resource (type of space booked), day (how busy was it each day) and by user / department.
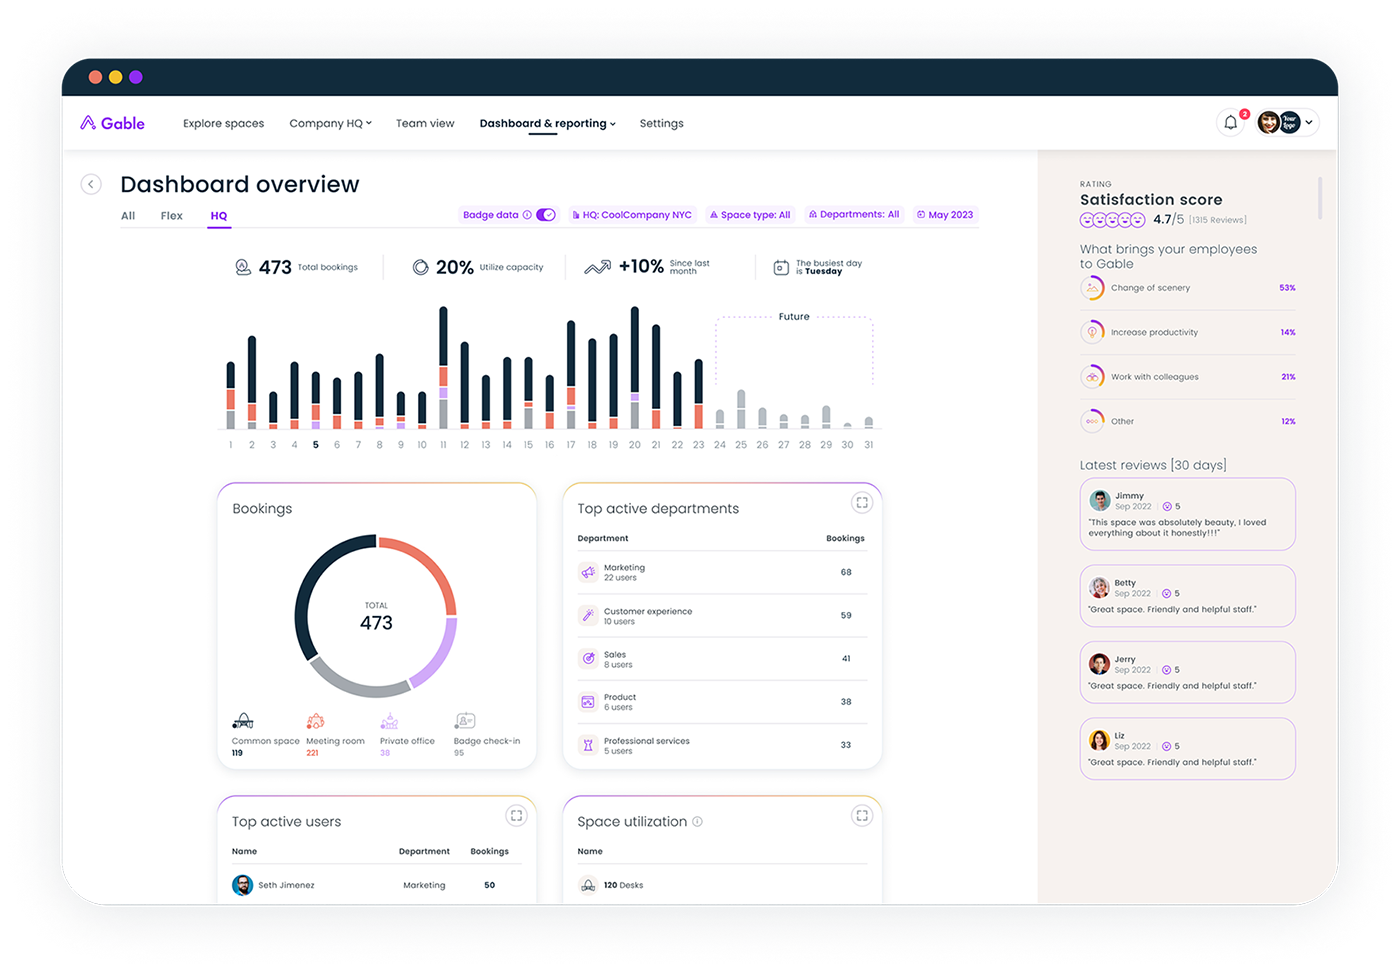
Satisfaction score and reviews
An important element of workplace data are qualitative and quantitative satisfaction and feedback surveys with end users coming on site.

Workplace performance against in-office policy target
Companies set targets to reach a certain office occupancy. To track workplace usage against general- or department specific in-office policies, workplace booking tools provide a great help.

Workplace usage by type of visits
Workplace visits can range from anything between hosted VS. unhosted visitors or walk-ins VS. registered VS. no-shows to visitors with NDA VS. no NDA, and more.

Conclusion and outlook #
Workplace data is often available in disparate systems that can offer unique insights when being combined. To get started quickly, some of the newer tools like workplace booking or cloud based security systems provide native analytics and often integrate with each other, so no custom data connection is required.
This data has value to plan workplaces efficiently to connect people and spaces better. It also impacts employee satisfaction, experience, and retention. Ultimately having the data in real time and easily available is crucial and ultimately leads to the popularity of cloud-based systems, such as the Kisi hybrid work physical security dashboard.